
Graphing Absolute Value Transformations: Let the Calculator Teach the Rules
“I could tell my students that subtracting inside moves the graph right. Or I could hand them a graphing calculator and let them catch it themselves. Only one of those sticks.”
Graphing absolute value transformations kicks off my favorite unit of the whole year. I love graphing, so I love teaching graphing. But for a long time I taught it the way most of us learned it: here’s the rule, here’s an example, now practice. And every year, the same thing happened. Students memorized “minus means right” for the quiz and had it backwards by the unit test.
So I stopped leading with the rule. Now my students discover the rules first, with a graphing calculator and a pattern to describe, and I don’t say a word about which way anything moves until they’ve told me.

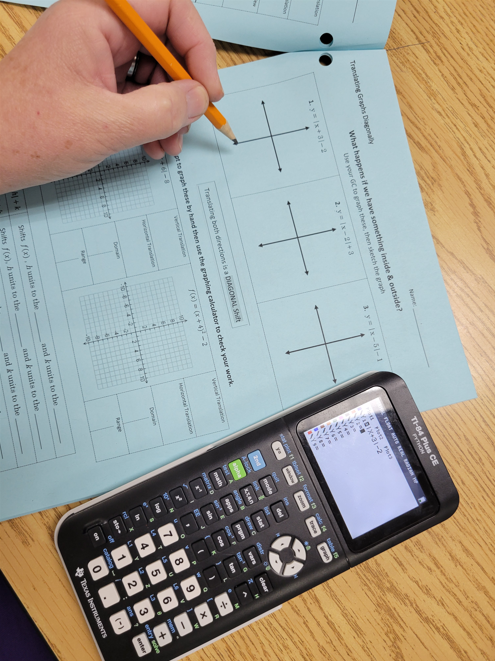
The discovery packet in action: graph it on the calculator first, sketch it, then describe the pattern.
Start With Play, Not Rules
The discovery packet starts with a quick calculator setup page: how to find the absolute value command, what to do when you’re stuck, and how to get the graph back on the screen. Then students start graphing.

The calculator setup page: every key they need, plus what to do when they’re stuck.
Each set of problems changes just one thing. Students graph y = |x|, then y = |x| − 5, then y = |x| − 1, then y = |x| − 3, and sketch them all on the same set of axes. Then they flip it and add outside the absolute value. At the bottom of each section is my favorite prompt in the whole packet: Describe the pattern you see.
Vertical shifts are the easy win. Add outside, the graph goes up. Subtract outside, it goes down. Students fill in the summary box themselves, and it makes sense to them because it’s what they’d expect.
The Horizontal Surprise
Then we move the number inside the absolute value bars, and this is where it gets good. Students graph y = |x + 5|, y = |x + 1|, and y = |x + 3|, and the graph slides left. They’re adding, and it moves the “wrong” way.
That “wait, that’s backwards” moment is exactly what I’m waiting for. If I’d told them the rule, it would just be one more fact to memorize. Because they found it on their own calculator screen, they own it. And the confusion is the hook: they actually want to know why it works that way.
The short version I give them: inside affects the x, the horizontal. Outside affects the y, the vertical. Whatever happens inside happens to x before anything else, so it works in the opposite direction from what you’d guess.
Free Resource: Absolute Value Transformations
A free absolute value translations activity you can use in class tomorrow. Grab it and I’ll send it straight to your inbox.
Get the Free Activity →Sketching vs. Graphing With Points
When students work on the calculator, they sketch. That’s on purpose. The sketch is about seeing the pattern, not about precision.
Once they’ve found the rules, I graph one with them by hand, and we talk about the difference. A sketch shows the shape and the direction. A graph is accurate: real points, plotted carefully, with a straight edge for absolute value. (Yes, I’m the teacher who makes them use a straight edge. Those V’s should be straight lines, not wobbly checkmarks.)

Every point in the parent table moves down 6. Straight edge required.
Know How to Get the Parent Function
I don’t require my students to memorize parent functions. I require them to know how to get them. We use x-values from −3 to 3 on every function, every time. They plug them in, talk through what the absolute value of a negative does, and build the table. After doing that a dozen times, guess what? They’ve memorized it anyway. It just happened on its own instead of being a list I handed them.
From there, graphing a transformation is just moving points. Shift every point in the table down 6, connect them with a straight edge, and you’re done. The table also makes domain and range easy to see: the domain doesn’t change, and the range moves with the vertical shift.
These Rules Work for Every Function
Here’s where the unit really opens up. Once students are comfortable with absolute value, I tell them: these rules aren’t absolute value rules. They work for every function. Let’s try a quadratic.

Same rules, new function: every point moves up 4.
Same table, same x-values from −3 to 3, same idea: move every point. The only new thing is that the parabola gets a smooth curve, not a straight edge. When students see that the exact same moves work on a completely different shape, the rules stop being “absolute value stuff” and become transformation stuff.

One set of rules for every function.
Putting Horizontal and Vertical Together
Once students are solid on horizontal and vertical shifts separately, we combine them. Same routine as before: they start on the graphing calculator and see for themselves that the shifts play nicely together. Then I show them how to graph it by hand with points. We do one absolute value, then one quadratic, so they keep seeing that it’s one set of rules.
By the end of this section, students can look at something like g(x) = |x − 3| + 2 and tell you exactly what happened to the parent function before they ever pick up a pencil. That’s the foundation for everything else in the unit: reflections, dilations, and eventually writing out full descriptions of a transformation in their own words.
What’s Next in This Series
Translations are just the start. In the next post, I’ll walk through how I teach reflections, why −f(x) and f(−x) do such different things, and how I handle dilations (including why I teach horizontal dilations, then show students it’s usually easier to pull the number out and treat it as vertical). After that, I’ll share how the unit ends: students writing full transformation descriptions, and my favorite end-of-unit project, the “Wanted” poster.
If your students keep getting the horizontal shift backwards, letting them discover it might be the missing piece.
It was for mine.
Activities for This Unit


📐 The Transformations Series
| Post | What It Covers |
|---|---|
| Translations (this post) | Discovering vertical and horizontal shifts with a graphing calculator, then graphing with points |
| Reflections & Dilations (coming soon) | −f(x) vs. f(−x), and why I pull horizontal dilations out as vertical |
| Writing Transformations (coming soon) | Describing transformations in words, and the “Wanted” poster project |
| Solving Absolute Value Equations & Inequalities | The “A” trick for isolating first, then splitting |
🔢 Bundles for This Unit

Leave a Reply