
The Missing Parabola: A Quadratic Poster Project for Algebra 2
“After almost 30 years of teaching, this is still the one project where I watch a struggling student and an honors student end up equally proud of the poster taped to the wall.”
Every year around the end of first semester, I run a quadratic poster project with my honors Algebra 2 students that starts with nothing but three mysterious points written on the board next to their name. No context, no explanation — just their own personal set of numbers. That’s when I know it’s time for my favorite project of the semester: the Missing Parabola.
This project has become my go-to end-of-semester assessment because it doesn’t just check whether students can graph a quadratic. It pulls together everything we’ve covered — systems of linear equations, standard form, vertex form, and every characteristic of a parabola we’ve talked about all unit — into one project that students actually enjoy finishing.
Every Student Gets Their Own Set of Points
Here’s the setup: each student receives their own unique set of three points. Not their table, not their partner — theirs. That one decision changes everything about how the project plays out in the room. Students can talk through the process with each other, compare steps, and give each other hints, but because every set of points is different, I always know the final work is their own.
It also means struggling students and strong students can sit right next to each other working on the “same” project, at the same pace, without anyone quietly copying the other’s answer. The “good” students end up reteaching the process to the students who are struggling, which is some of the best review I could ask for — and I’m not the one doing the reteaching.
From Three Points to a Quadratic Equation
Students take their three points and use them to write a system of three linear equations to solve for a, b, and c in standard form. Once they solve the system, they use those values to write their quadratic equation.
I built every set of points so the system always solves to integer values of a, b, and c. That’s on purpose — if a student lands on a decimal, they know immediately they made a mistake somewhere and need to go back and check their work instead of turning in a wrong answer without realizing it.
Finding the Vertex — and Centering the Graph
Once students have their equation in standard form, they use it to find the vertex. Then comes the part students always find trickier than they expect: I hand them a completely blank graph — no axes drawn in at all.
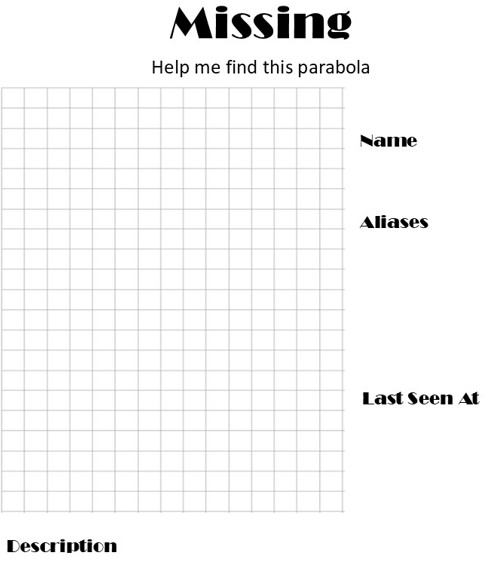
The blank “Missing” poster template — no axes drawn, ready for students to place their own
Students have to figure out where the x-axis and y-axis need to go so that their parabola sits centered on the page with the vertex near the top or bottom. It’s a small step, but it forces them to actually think about scale and placement instead of just plotting points on a pre-made grid — and it trips up more students than you’d expect the first time they try it.
Free Resource: Blank Graph Template
The same blank-grid template I hand my students for this project — no axes, ready for them to place their own.
Download the Free Blank Graphs →Building the Quadratic Poster: The Missing Parabola
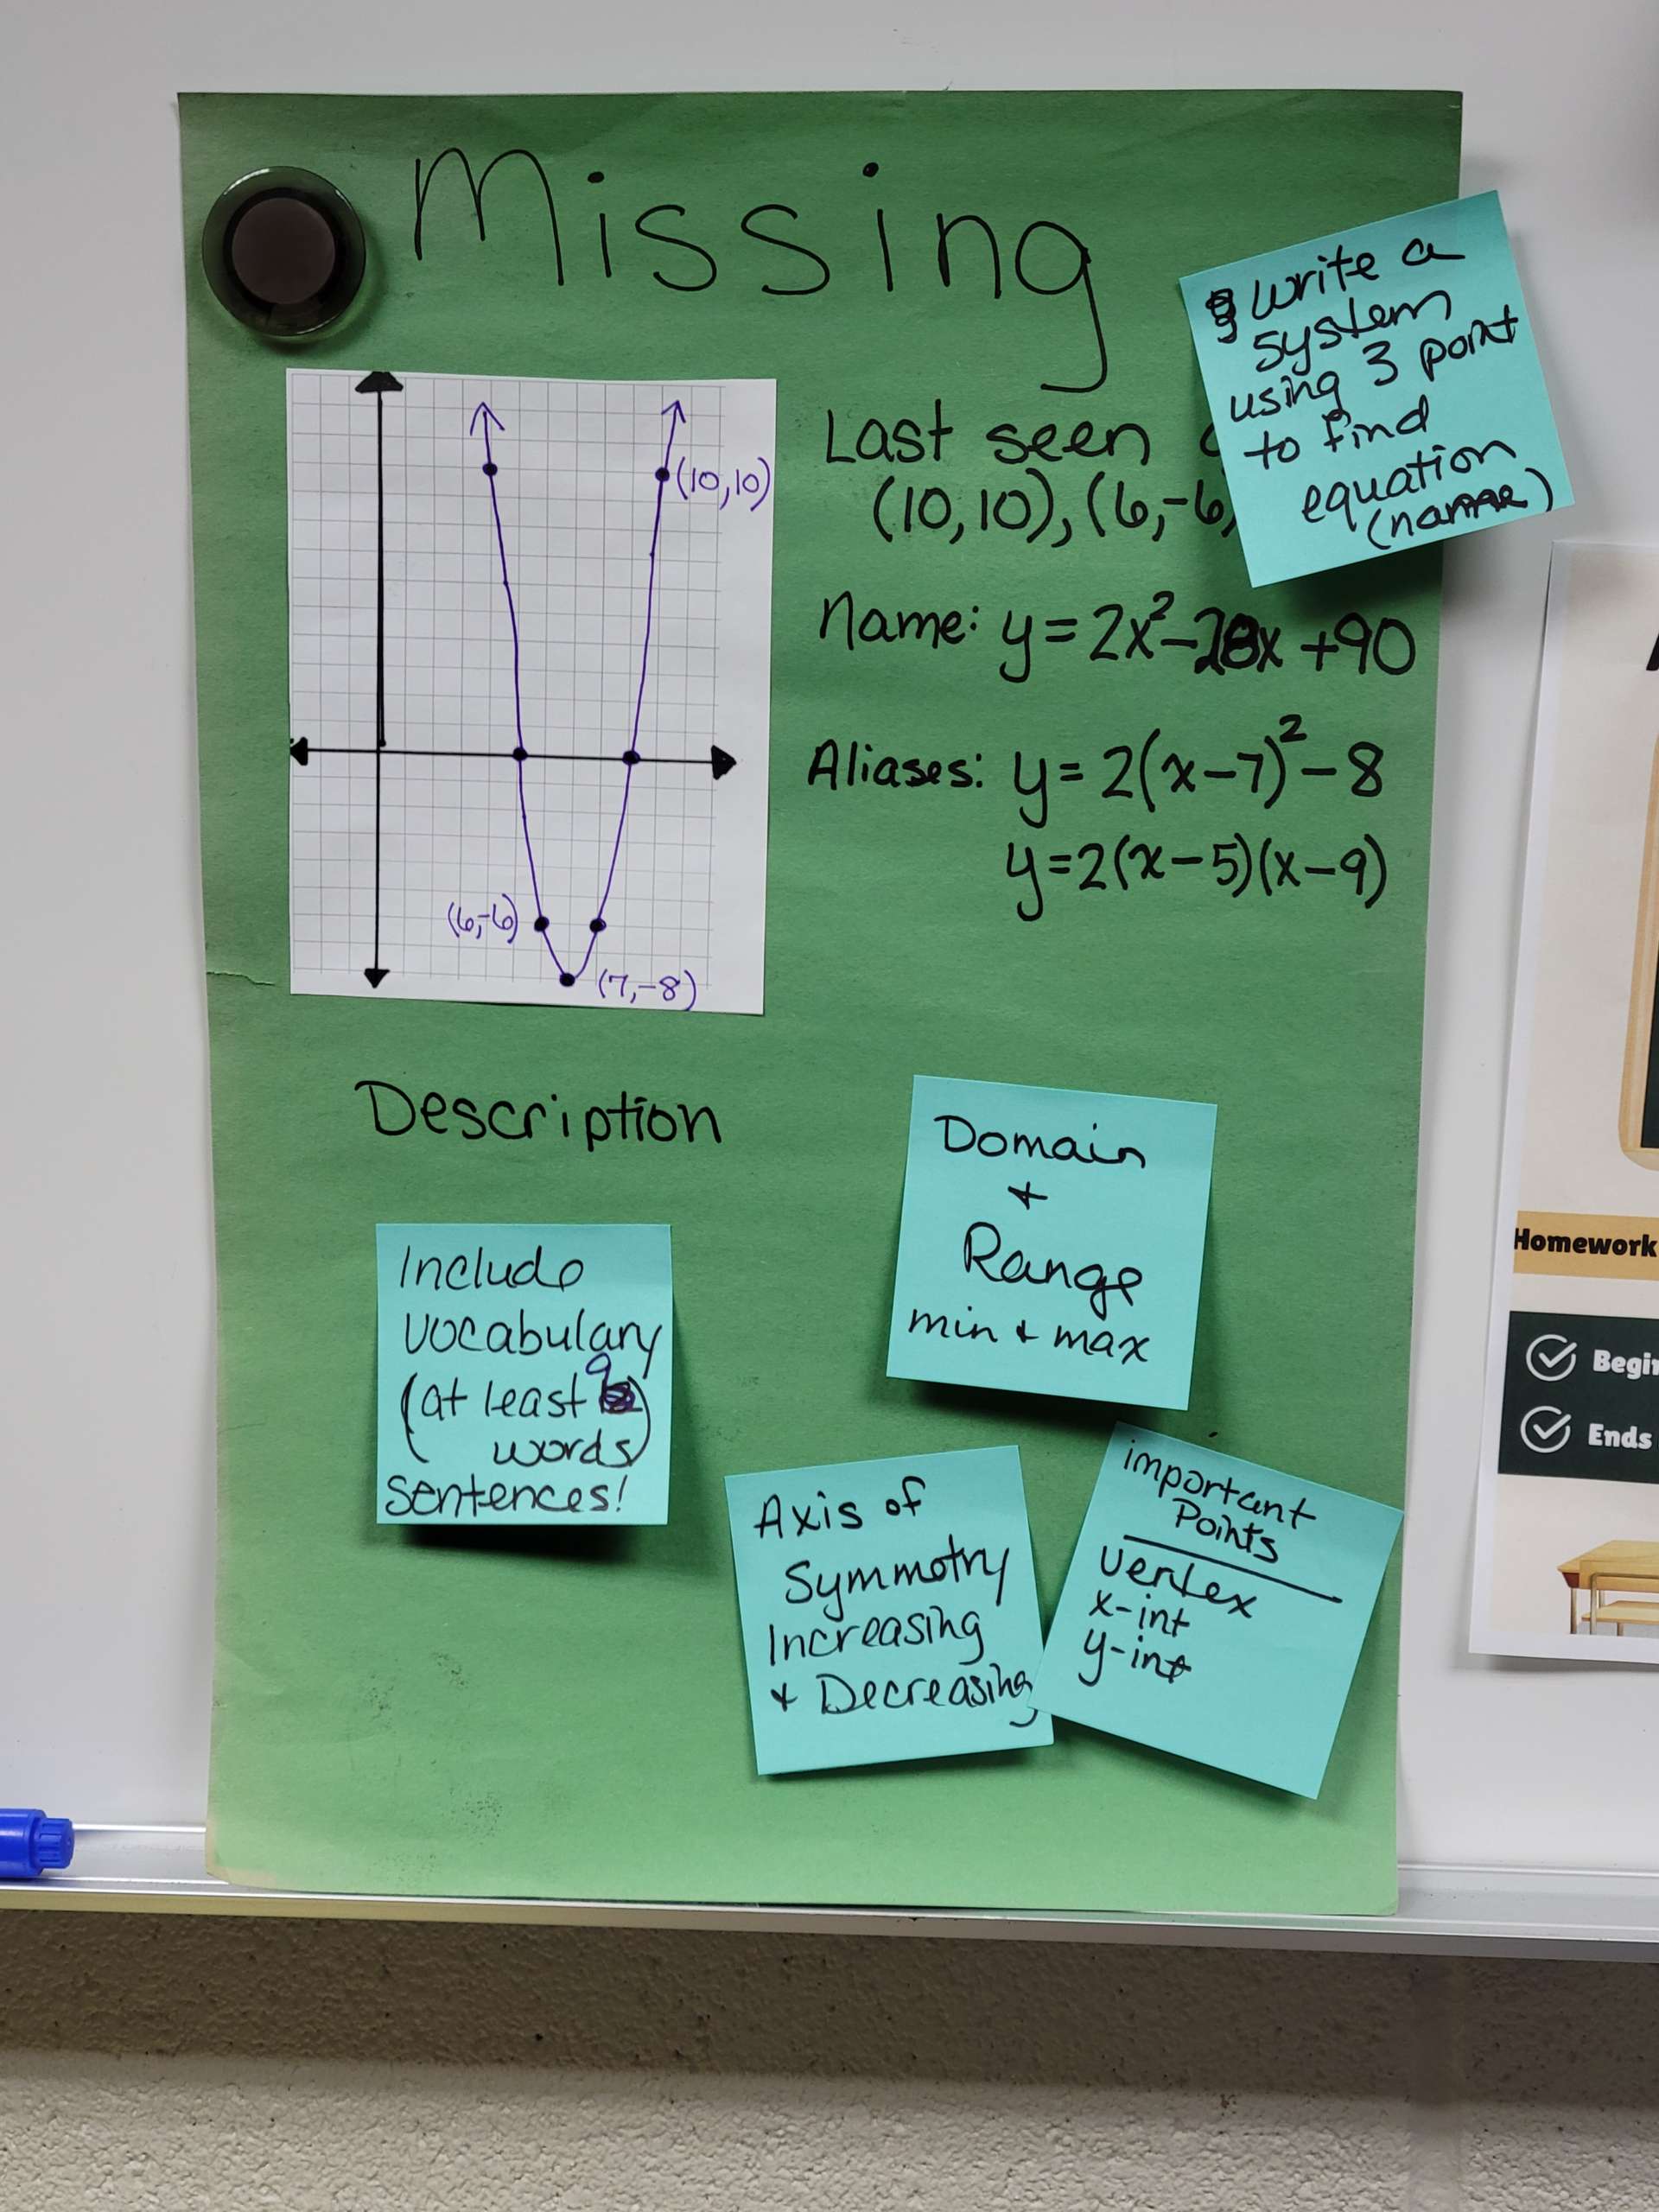
Once students have their equation and their graph, they pull together every characteristic we’ve covered all unit: domain, range, increasing and decreasing intervals, minimum or maximum value, vertex, and x- and y-intercepts. All of it gets organized onto a “Missing” or “Wanted” poster for their parabola — equivalent equations and all, since a parabola in standard form, vertex form, and factored form is still the same “person” with different aliases.

An example finished “Missing” poster — graph, equation aliases, key points, and description
Some years, when the district is pushing writing across the curriculum, I add a paragraph requirement where students describe the transformations from the parent graph in their own words. It’s a nice way to layer in writing standards without it feeling like busywork tacked onto a math project.
Why I Love the Differentiation Built Into This
I give this same project to every class, but I can quietly differentiate just by choosing what I hand each student. Some point sets produce a parabola with a stretch factor and some don’t. Some sets include the x-intercept or y-intercept outright, which makes the system easier to solve. For my classes that need more support, I skip the three-points version entirely and just hand them the equation in standard or vertex form so they can go straight to graphing and identifying characteristics.
Same project, same rubric, same wall full of posters at the end — just a different entry point depending on what each class needs.
Want to Build Your Own Version of This Project?
If you want to try this format with your own students, here’s the trick that makes it work: graph the parabola first, then pull your three points off of it. Picking random points and working backward almost never gives you clean numbers — starting from the graph is by far the easiest way to land on nice, integer-friendly equations.
Once you have that system down, this format stretches well past quadratics. I’ve built a similar version for Absolute Value using a point plus a description of transformations instead of three points, and I’m rolling out a Polynomials version this spring using a labeled graph instead of points at all. Both are different enough from this project that they deserve their own posts — I’ll walk through each one in detail soon.
For any version of this, having the vocabulary posted where students can see it makes a real difference. I keep my Parts of a Graph & Functions word wall posters up all year, and students end up referencing them constantly while they’re working through projects like this one.
A Second Quadratics Poster Project: Name That Parabola
If the systems-of-equations version feels like too much for a class, I have a simpler quadratics poster project — Name That Parabola — that works well as a companion or an earlier checkpoint in the unit. Instead of starting from three points, students start from a graph of a parabola and have to find the equation in all three forms — standard, vertex, and intercept — straight from what they can read off the graph.
It’s a nice bridge project: no system of equations to solve, just graph-reading and moving fluently between forms. It comes with 16 graphs, 2 levels, and 2 size options, so I often use it earlier in the unit, before students are ready for the full three-points version, or as a lighter alternative for classes that need more scaffolding.
Free Resource: Solving Quadratics Walk-Around
If your students need more quadratics practice before tackling a project like this one, grab my free walk-around activity.
Get the Free Walk-Around →The Unexpected AI-Resistance Bonus
I didn’t build this project to be AI-proof, but it turns out to be one of the more resistant assessments I give. Math AI tools are getting better every year, but they still struggle when a student has to describe how they graphed a parabola using a non-standard method — like placing their own axes on a blank grid. The description an AI gives almost never matches how I actually asked students to work through it, which makes it pretty easy to spot when something doesn’t add up.
It also just covers a lot of ground. Graphing quadratics in standard form, solving systems of equations, writing equivalent functions — this one project touches more standards than almost anything else I assign all semester.
Grab It on TPT
I recently uploaded this exact project to my TPT store. It includes student and teacher directions, 25 problems (a mix of given three points, standard form, and vertex form so you can differentiate the same way I do), templates, worked examples, a rubric, and a full answer key.
If you’re looking for one project that reviews systems of equations, quadratics, and characteristics of a parabola all at once — and still leaves room for every student to succeed at their own level —
this is the one I keep coming back to every year.

More Quadratics Activities

📐 More From the Quadratics Series
| Post | What It Covers |
|---|---|
| Quadratic Formula | Teaching the formula and why the discriminant changes everything |
| Square Root Property | Why the order of instruction matters more than you think |
| Completing the Square | A step-by-step approach starting with patterns first |
| Matching Activities | Using the y’all do phase as a powerful check for understanding |
| Graphing Quadratics Walk-Around Activities | Walk-around practice for graphing quadratics before tackling a poster project |
| Missing Parabola Poster Project (this post) | An end-of-semester project combining systems of equations and quadratic characteristics |
🔢 Bundles for the Quadratics Unit
Leave a Reply